The Video from 2025
from scipy.fft import fftfreq
import matplotlib.pyplot as plt
import numpy as np
import librosa
Roar. Bears, the video I made for my birthday in 2025 is something I always bragged about. That statement “No screen recording, no video editing, and no [generative] AI [is required]” made me feel proud and made the cubs wow at least for the whole week.
Unfortunately I can’t post it on YouTube due to copyright reasons, but here’s a screenshot of what it looked like at that time.
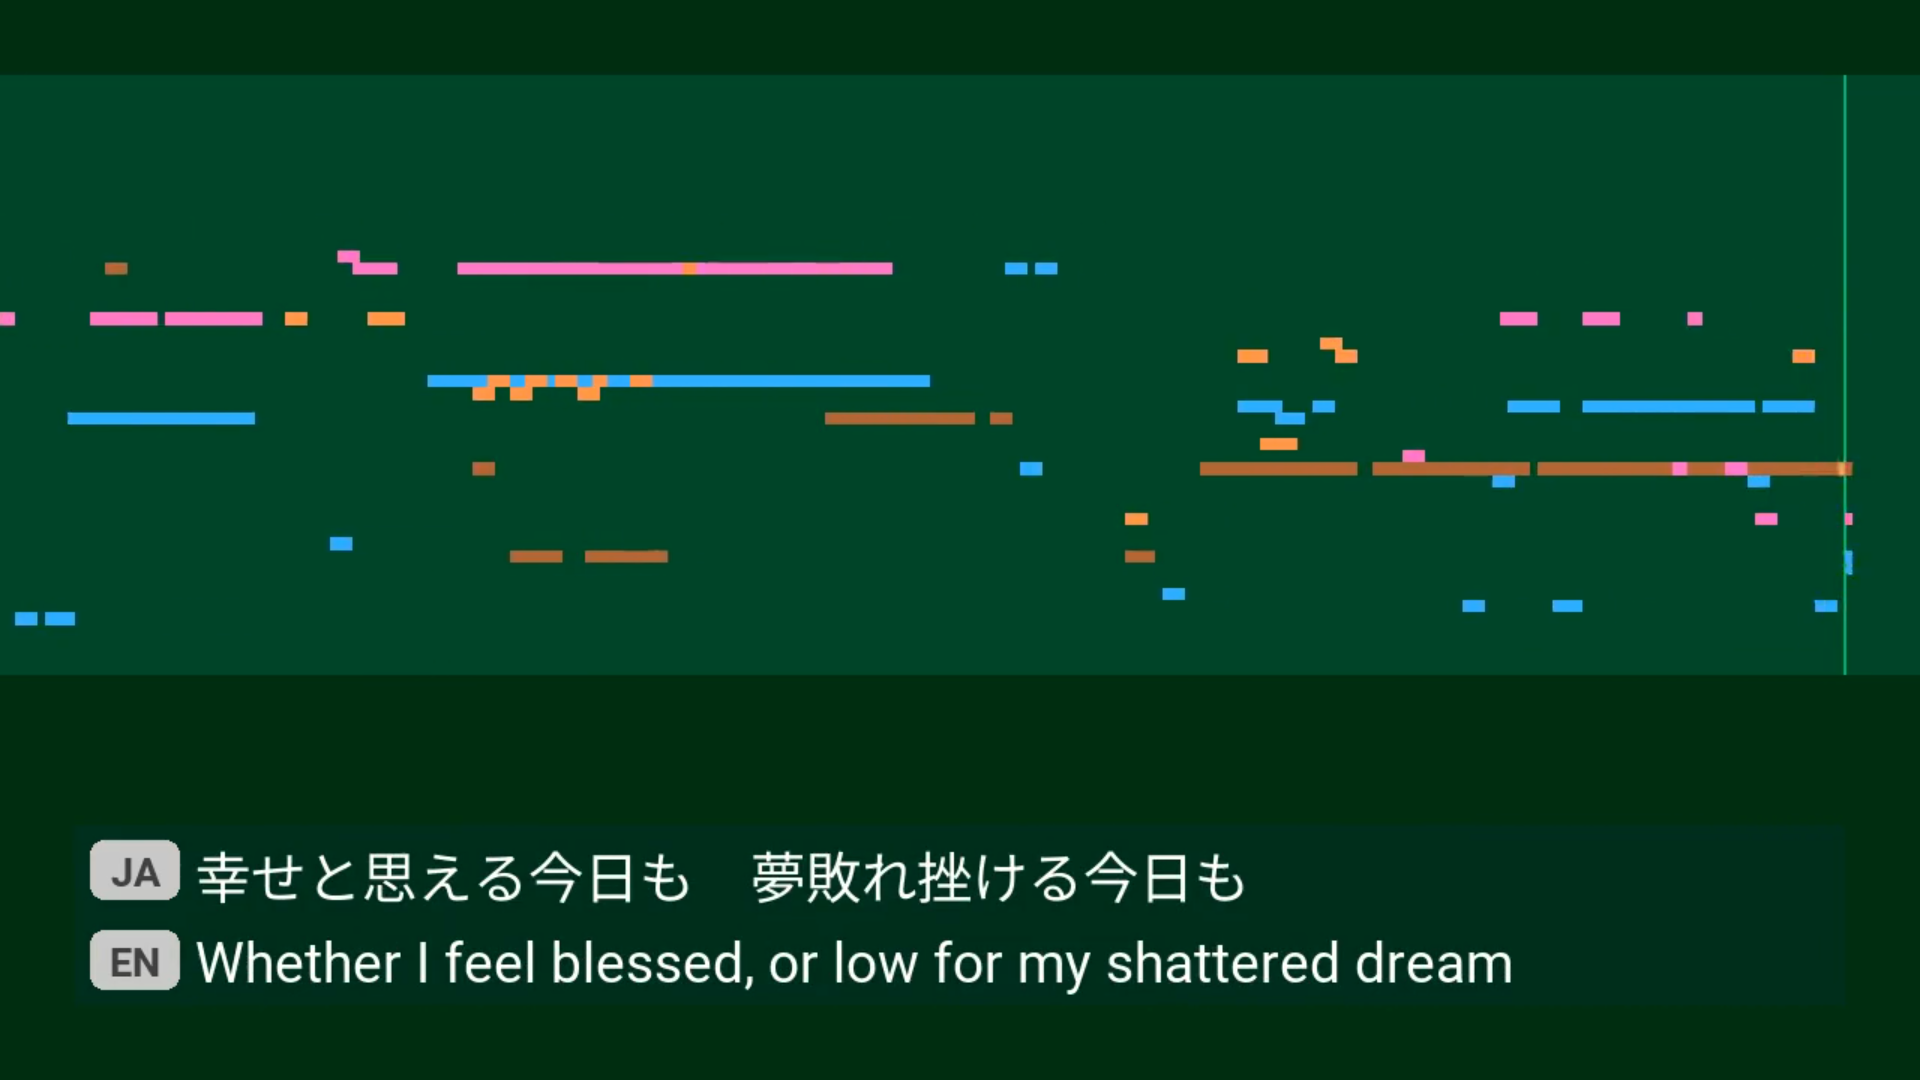
Figure 1:A screenshot of the video from the birthday celebration from 2025
You can see the pitch bars were completely messed up 😅 and there was a slight mismatch between the background of the lyrics and the video. But hey, I and the cubs both liked it. That’s the point at the time, right?
Today, however, the objective of looking at this video is different. I’m now looking for new ways to draw what I sing, so I shall look at it from the angle of the audio features drawn and how they were drawn.
Features from Audio
The video was supposed to be a Karaoke-style visualisation, so only frequency data was used.
At the time, because I wanted to get the notes I sang, and notes are related to frequencies, I applied Fourier Transform and picked the frequency with the highest power and calculated the note. This was a straightforward idea, and it was easy to implement: Scipy had the method available, and I just needed to pick the highest one. Easy, right?
It turned out this had several problems. First, the frequencies of musical notes might not align with the frequencies in the Fourier transform. To give some context, let’s say the sound wave was sampled at 22,050Hz, and I use a 2048-point FFT (Fast Fourier Transform). The frequencies in this Fourier Transform would be multiples of Hz (marked as dots).
Whereas, the frequencies corresponding to notes are 440Hz multplied by , where is the number of semitones higher than an A4 (use negative values for notes lower). These are marked as crosses in the figure.
sample_rate = 22050
n_fft = 2048
freqs = fftfreq(n_fft) * sample_rate

freqs
array([ 0. , 10.76660156, 21.53320312, ..., -32.29980469,
-21.53320312, -10.76660156], shape=(2048,))f = freqs[(freqs <= 440) & (freqs >= 110)]
z = np.zeros(len(f))
n = np.pow(2.0, np.arange(-24, 1) / 12) * 440
n = n[(n <= 440) & (n >= 110)]
zn = np.zeros(len(n))fig, ax = plt.subplots(figsize=(8, 2), dpi=100)
ax.scatter(f, z, marker=".", label="FFT Frequencies")
ax.scatter(n, zn, marker="x", label="Note Frequencies")
ax.set_title("FFT and Note Frequencies (from 110Hz to 440Hz)")
ax.set_xlim(110, 440)
ax.set_ylim(-0.02, 0.02)
ax.legend()
fig.tight_layout()
plt.show()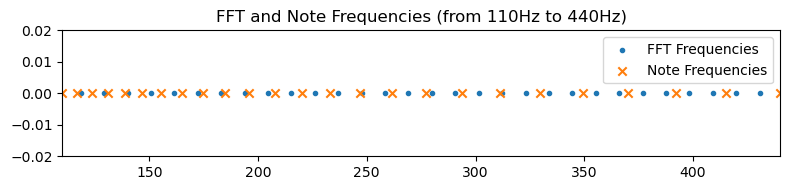
Second, as I mentioned in an explainer video back then, the sound I make while singing one note is not just one at that frequency. It’s also got harmonics, often called “overtones” (“倍音” in Japanese) by musicians. Look at the frequency spectrum below. The frequency between 500 and 750 is the note I was singing, and the one near 1250 is the first-order harmonics.
y, sr = librosa.load("./sample.wav")
n_fft = 2048
spec = librosa.stft(y, n_fft=n_fft)
fs = librosa.fft_frequencies(sr=sr, n_fft=n_fft)
selection = np.where((fs > 110) & (fs < 1760))
frame = 200
fs = fs[selection]
amp = librosa.amplitude_to_db(np.abs(spec[selection, frame]), ref=np.max).T
fig, ax = plt.subplots(figsize=(8, 3), dpi=100)
ax.set_title(f"Spectrum of Singing at Frame {frame}")
ax.set_ylim(-60, 0)
ax.set_xlabel("Frequency / Hz")
ax.set_ylabel("Loudness / dB\nrelative to the loudest in frame")
ax.plot(fs, amp)
fig.tight_layout()
plt.show()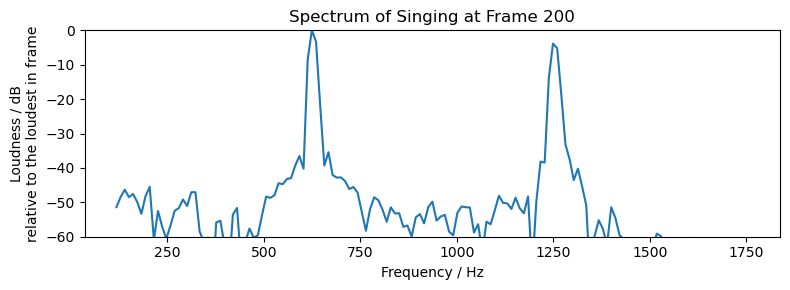
Sometimes one of these harmonics can become louder than the fundamental frequency. At other times, what I thought I was singing was actually a very loud overtone and my vocal cords were vibrating at a frequency one octave lower. These all cause problems to my simplistic approach. I later looked up for approaches like harmonic product spectrum1, but it didn’t work well either - rather than giving me notes that are octaves higher, it gave me notes octaves lower instead.
It wasn’t until about two months later that I found the YIN algorithm2, which extracted the notes I sang correctly except for a few extra noisy data points. I know this sound noobish, at least to the version of me today. But this experience can at least show why simple Fourier Transform does not work out of the box, and why we need to look into improved methods.
Lyric Sequence
Another piece of data used was the lyric sequence. I copied down the lyrics, translated them into English and recorded the time when each line should enter the scene.
At the time, I wrote a small tool to record the timeing for each line of lyrics. The way it worked was simple: a window opens, showing nothing and playing the music. I could press the space bar and it would draw the next line of lyrics from Japanese and English sequence and record the time. In the end when I closed the window, it would write all the times recorded to a text file. I then read the lyric lines and the times and programmed animation for them.
The programme was less than 100 lines of code. In fact, it was so simple that even a cub can code one itself. It, however, saved me hours of video editing and got the time right in just 5 minutes, the length of the song.
Drawing the Features
The frequency data and the lyric sequence were drawn using Pyglet. The former was drawn as rectangles representing pitch bars. The latter was drawn as regular text with a simple transition effect.
Back when I was making the video, I was helping a coding club for cubs. The cubs made games Pygame, and that was what I was most familiar with. But, for some reason, I chose Pyglet for the video instead. I guess at the time I had anticipated the need to make visuals using shaders, or perhaps I was just being nostalgic, looking back on the OpenGL days.
I noticed several differences moving from Pygame to Pyglet, other than the former uses software rendering by default while the latter uses OpenGL (hardware-accelerated) rendering.
In Pygame, each time the screen is cleared for the frame, you would redraw everything from the current data stored in them, as if nothing has been drawn previously. In Pyglet, however, even after the screen is cleared, the vertex buffer is still there, the batch (if you use batched rendering) is still there, and memory allocated for vertex buffer data is still there. So rather than redrawing everything, you modify existing shapes. If you need to delete something, you must explicitly delete it3.
In Pygame, there is a concept of
Surfacethat represents a block of pixels. You can draw things onto aSurface, and everything drawn outside will be clipped automatically because the pixel data has no place on theSurface. In Pyglet, however, there are only vertices. Unless the shader discards the fragment or specific OpenGL flags are set, they will be drawn to the screen. To have OpenGL clip what’s outside a rectangle, one enables the scissors test while drawing then disables it again.
No Screen Recording Required?
Back when I was studying Creative Technology (2019), one thing my classmate often said was “I will just write a programme [that draws something with code] and record everything on the screen for my video.” So last year, I thought my idea of making algorithmic drawing videos without screen recording was a cool idea and would definitely excite the cubs, if not those classmates from back then.
And it did.
I used FFMpeg for this process. FFMpeg has been well known to me for a long time, but I only realised I could “generate” videos from code was when I saw the DeepDream streaming example4. The example demonstrated use of subprocesses5 to read image data from the stdout of, and write image data to the stdin of an FFMpeg process. The Python process in between can literally do anything Python can do to the image data and write any valid (in terms of the format argument supplied to FFMpeg) image data to FFMpeg.
Based on that logic, in every frame I obtained the frame buffer that had what was in the window and wrote the image data to the FFMpeg process, which then turned the frames into a video. There was just one annoying thing about subprocesses, which was error handing. When my Pyglet window throws an exception, I want the FFMpeg process to stop with it. This was not straightforward. The only way to stop an FFMpeg subprocess seemed to be to close its stdin, so that FFMpeg will think the input is done and terminate. But I was, and still am, new to interprocess communication, so there might be more intuitive way to deal with this.
From that point on, reading from stdin and writing to stdout is no longer constrained to input() and print() for me.
Conclusion
My intent in writing this post was to document some ideas while making the video I made for my birthday last year, which was a huge success to me. The most important things were the data source it used and how it was drawn, including the signal processing and OpenGL techniques. These are things I already know and can be useful in the future.
But while writing this, I also found the importance of tools. The lyric sequence tool saved me the entire hours of video editing, and FFMpeg removed the need to record the screen, which will again need to be cropped and trimmed. I don’t know FFMpeg very well. In fact, the FFMpeg command that I needed for my video was written by Gemini. The FFMpeg CLI is complex, even more so when filters are applied. But on the flip side, it opened up my view of processes and let me rethink about stdin and stdout.
- Harmonic Product Spectrum (HPS). (n.d.). Retrieved May 12, 2026, from http://musicweb.ucsd.edu/~trsmyth/analysis/Harmonic_Product_Spectrum.html
- librosa.yin — librosa 0.11.0 documentation. (n.d.). Retrieved May 12, 2026, from https://librosa.org/doc/0.11.0/generated/librosa.yin.html#librosa.yin
- pyglet.shapes — pyglet v2.1.14. (n.d.). Retrieved May 12, 2026, from https://pyglet.readthedocs.io/en/latest/modules/shapes.html#pyglet.shapes.ShapeBase.delete
- ffmpeg-python/examples/README.md at master · kkroening/ffmpeg-python · GitHub. (n.d.). Retrieved May 12, 2026, from https://github.com/kkroening/ffmpeg-python/blob/master/examples/README.md#tensorflow-streaming
- subprocess — Subprocess management. (n.d.). In Python documentation. Retrieved May 12, 2026, from https://docs.python.org/3/library/subprocess.html